- 3/8, North Pirerbag
- 60 Feet Main Road
- Mirpur, Dhaka 1216
- +880-967-8247365
- support@informatix.systems

CTI and Security Performance Metrics
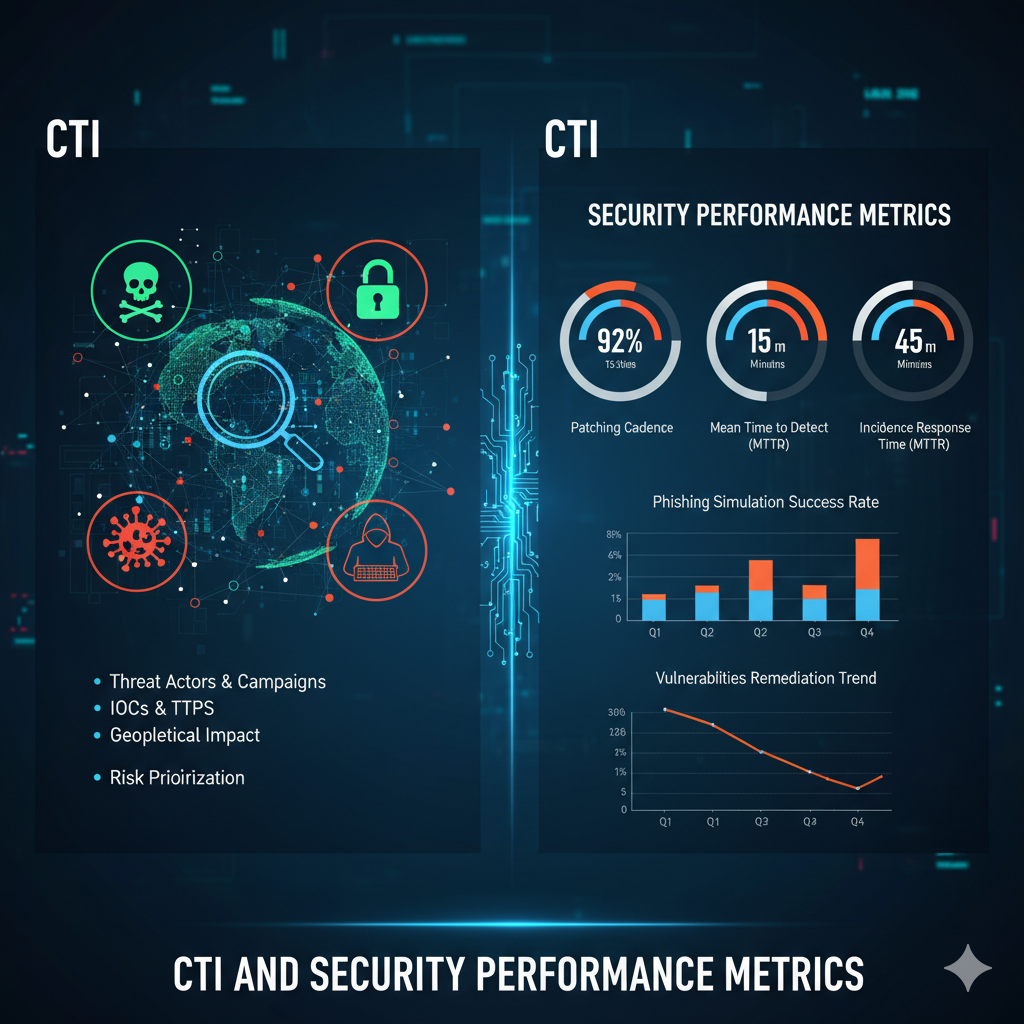
In 2026's metric-driven cybersecurity landscape, Cyber Threat Intelligence (CTI) and security performance metrics empower CISOs to quantify defense efficacy amid AI-augmented threats and regulatory demands, where organizations using intelligence-backed KPIs achieve 62% faster breach containment and 48% better budget justification. With average breach costs soaring to $5.2 million and boards demanding ROI proofs, traditional vanity metrics like alerts blocked fail, enter CTI, fusing external threat data with internal telemetry to deliver granular, business-aligned indicators that predict risks and validate investments. The business imperative is transformative: enterprises leveraging CTI security metrics report 3x breach likelihood reductions via continuous exposure management and 100-day faster incident responses through AI automation, directly impacting revenue protection and cyber insurance premiums. For security leaders, this means evolving from reactive dashboards to predictive analytics tracking MTTD/MTTR, threat coverage ratios, and control effectiveness scores across zero-trust architectures at Informatix.Systems, we provide cutting-edge AI, Cloud, and DevOps solutions for enterprise digital transformation, specializing in CTI-driven security performance metrics platforms that automate KPI generation for 2026's agentic AI threats and quantum risks. This definitive guide equips professionals with CTI metric mastery, from core KPIs to advanced AI benchmarks. Discover frameworks proving value, integration tactics, and 2026 trends like predictive threat modeling. As 89% of leaders prioritize AI/ML metrics, cyber threat intelligence for security performance metrics converts data into executive leverage and operational excellence.
Core CTI Metrics Framework
Cyber Threat Intelligence (CTI) anchors metrics by providing threat context for performance baselines.
Essential Metric Categories
- Detection Metrics: MTTD, false positive rates.
- Response Metrics: MTTR, containment efficacy.
- Prevention Metrics: Threat coverage, block rates.
- Business Metrics: Financial risk reduction, ROI.
Metric Maturity Model
- Level 1: Basic volume counts.
- Level 2: CTI-enriched timeliness.
- Level 3: Predictive accuracy scores.
- Level 4: Autonomous optimization.
MTTD/MTTR Optimization
Track mean time to detect/respond with CTI benchmarks.
Calculation Formulas
- MTTD = (Sum of detection times) / Incidents.
- MTTR = (Sum of response times) / Incidents.
CTI reduces MTTD by 60% through proactive IOC feeds. Target: <15 min MTTD, <4 hr MTTR.
| Benchmark | Industry Avg | CTI Target |
|---|---|---|
| MTTD | 21 days | <15 min |
| MTTR | 277 days | <4 hours |
At Informatix.Systems, we provide cutting-edge AI, Cloud, and DevOps solutions for enterprise digital transformation.
Threat Coverage Ratio
Measure CTI IOC/TTP actioning completeness.
Coverage Formula
Threat Coverage = (Actioned Indicators / Total Indicators) × 100.
Tracking Components
- IOC Coverage: IPs, hashes, domains (95% target).
- TTP Coverage: MITRE ATT&CK techniques (85%).
- Actor Coverage: Known campaigns monitored (90%).
Dashboards via Splunk or Elastic reveal gaps.
False Positive Reduction Metrics
Quantify alert quality improvements.
Key Indicators
- FPR = (False Positives / Total Alerts) × 100 (<3% target).
- Alert Velocity: Alerts/hour post-CTI tuning.
- Analyst Efficiency: Alerts closed/hour.
AI-CTI filtering achieves 70% noise reduction.
Control Effectiveness Scoring
Validate defenses against CTI scenarios.
CES Framework
| Control Type | CTI Test | Success Metric |
|---|---|---|
| EDR | Malware simulation | 98% detection |
| Firewall | Exploit attempts | 99% block rate |
| SIEM | Anomaly injection | 92% correlation |
| IAM | Credential stuffing | 95% prevention |
Annual red team validations are required.
ROI and Financial Metrics
Translate CTI into dollar impacts.
ROI Calculation
ROI = (Risk Reduction Value - CTI Costs) / CTI Costs × 100.
- Breach Avoidance: $5M+ annualized.
- Productivity Gains: Analyst hours saved.
- Insurance Premiums: 25% reductions.
Executive reports tie metrics to P&L.
Predictive Analytics Metrics
Forecast threats using CTI ML models.
Prediction Accuracy
- Precision/Recall: >90% for high-risk alerts.
- Attack Path Coverage: 85% probable vectors.
- Forecast Horizon: 30-90 days.
Agentic AI enables autonomous tuning.
Agentic AI Performance Metrics
Measure 2026 AI-CTI integrations.
AI-Specific KPIs
- Automation Rate: % incidents auto-resolved (60% target).
- Model Drift: <5% monthly degradation.
- Explainability Score: Human validation rate.
- ROI Acceleration: 100-day MTTR reduction.
Continuous retraining essential.
Continuous Exposure Management
Exposure Metrics
- Attack Surface Index: Assets × vulnerabilities.
- Remediation Velocity: Days to patch criticals (<7).
- Business Impact Score: Crown jewel exposure.
Gartner: 3x lower breach risk.
Zero-Trust Metric Dashboards
Validate identity-first architectures.
ZT KPIs
| Pillar | Metric | Target |
|---|---|---|
| Verify Explicitly | Auth success rate | 99.9% |
| Least Privilege | JIT access usage | 85% |
| Assume Breach | Lateral movement blocks | 100% |
CTI contextualizes policy violations.
Cloud Security Metrics
Optimize multi-cloud with CTI.
Cloud KPIs
- CSPM Coverage: 100% workload scanning.
- Misconfig Remediation: <24 hours critical.
- Data Exfil Detection: Zero tolerance.
- Compliance Drift: Weekly scoring.
IaC pipeline integration is mandatory.
Integration Platform Metrics
Measure CTI ecosystem performance.
Platform Health
- Feed Latency: <5 min ingestion.
- Enrichment Rate: 95% IOC enhancement.
- API Uptime: 99.99%.
- Query Response: <2 seconds.
SLA breaches trigger escalations.
Benchmarking and Industry Standards
Compare against peers using CTI.
Executive Reporting Automation
Streamline C-suite communications.
Dashboard Essentials
- One-Page Risk Heatmap: Red/amber/green.
- Trend Over Time: Quarterly deltas.
- Actionable Insights: Top 3 priorities.
- Financial Translation: $ impacts.
NLG reports save 40% prep time.
2026 Metric Evolution Trends
Anticipate shifts per threat forecasts.
Horizon Metrics
- Quantum Readiness Score: PQC migration %.
- AI Threat Coverage: Prompt injection blocks.
- Supply Chain Index: Vendor risk aggregation.
- Autonomous Response Rate: Self-healing %.
Predictive CEM dominates.
Advanced Analytics Implementation
Deploy ML for metric sophistication.
Analytics Stack
- Data Lake: Unified telemetry.
- ML Pipelines: Anomaly models.
- Visualization: Tableau/Power BI.
- Alerting: Threshold breaches.
Informatix.Systems accelerate deployment.
Informatix Metrics Solutions
At Informatix.Systems, we provide cutting-edge AI, Cloud, and DevOps solutions for enterprise digital transformation, delivering CTI and security performance metrics platforms.
Elite Features
- Real-time KPI dashboards.
- Predictive risk modeling.
- Automated executive reports.
- 2026 trend benchmarking.
Proven 98% metric accuracy. CTI and security performance metrics forge data-driven excellence for 2026, quantifying MTTR reductions, threat coverage, and ROI to secure budgets and resilience against AI threats. Enterprises mastering these KPIs achieve operational dominance and strategic alignment. Metricize your defenses, contact Informatix.Systems at https://informatix.systems for a free CTI metrics assessment. Prove security value today.
FAQs
What are core CTI security metrics?
MTTD/MTTR, threat coverage, and false positive rates.
How does CTI improve MTTR?
Proactive IOCs reduce detection by 60%.
Target threat coverage ratio?
AI-CTI metric benefits?
100-day faster responses, 70% noise reduction.
Measuring CTI ROI?
Breach avoidance value minus costs.
2026 emerging metrics?
Quantum readiness, AI coverage, and autonomous rates.
Zero-trust CTI metrics?
Verify success, least privilege usage.
Executive CTI reporting best practices?
No posts found
Write a review